Analysis
Analysis
Having produced one or more fault trees, the fourth and final step is analysis of these fault trees. As with synthesis, this can be done on an ad-hoc individual basis — for a particular fault tree — or immediately as part of a full analysis for one or more system failures. In the latter case, an FMEA is also generated.
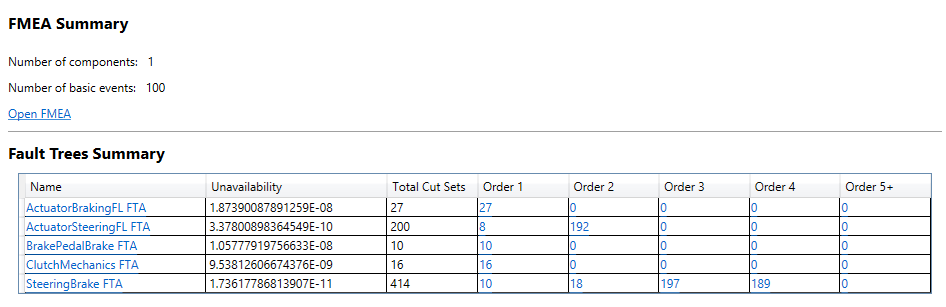
Results summary
1. FMEAs
Using multiple fault trees representing different system failure makes it possible to generate an FMEA that describes the effects of the various failure modes, with hyperlinks to the fault trees representing each effect as well as links back to the components in the system models where the failure modes originate.
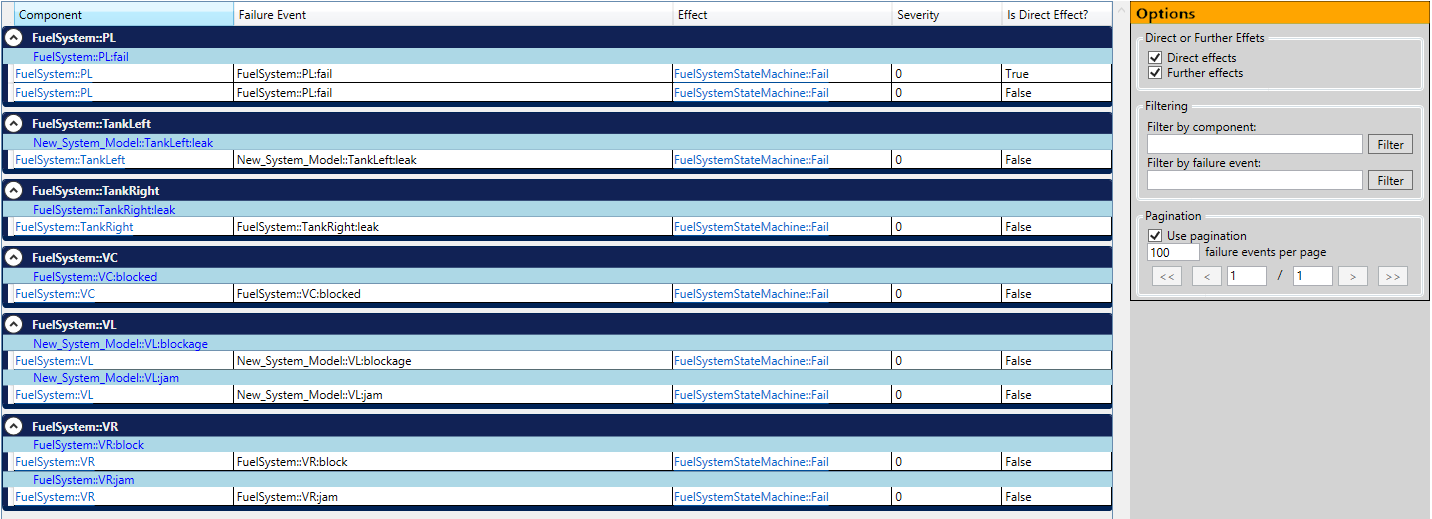
FMEA Results
FMEA results can be filtered and sorted, as well as customised in other ways. Furthermore, the FMEAs generated by Dymodia are multiple failure mode FMEAs; whereas a standard FMEA only shows the direct effects of an individual failure mode, multiple failure mode FMEAs also show the possible effects of multiple failure modes occurring in conjunction (known as further effects in Dymodia). It is possible to click on these to be taken to the cut set showing all other failure modes that contribute to the given system effect.
2. Fault Tree Analysis
Fault tree results are include both quantitative and qualitative results. The latter is in the form of minimal cut sets — the smallest combination of events necessary to cause the system event being analysed.
If probabilistic failure data was provided for basic events or component failures, then an estimate for the overall unavailability is calculated, as well as for each individual cut set.
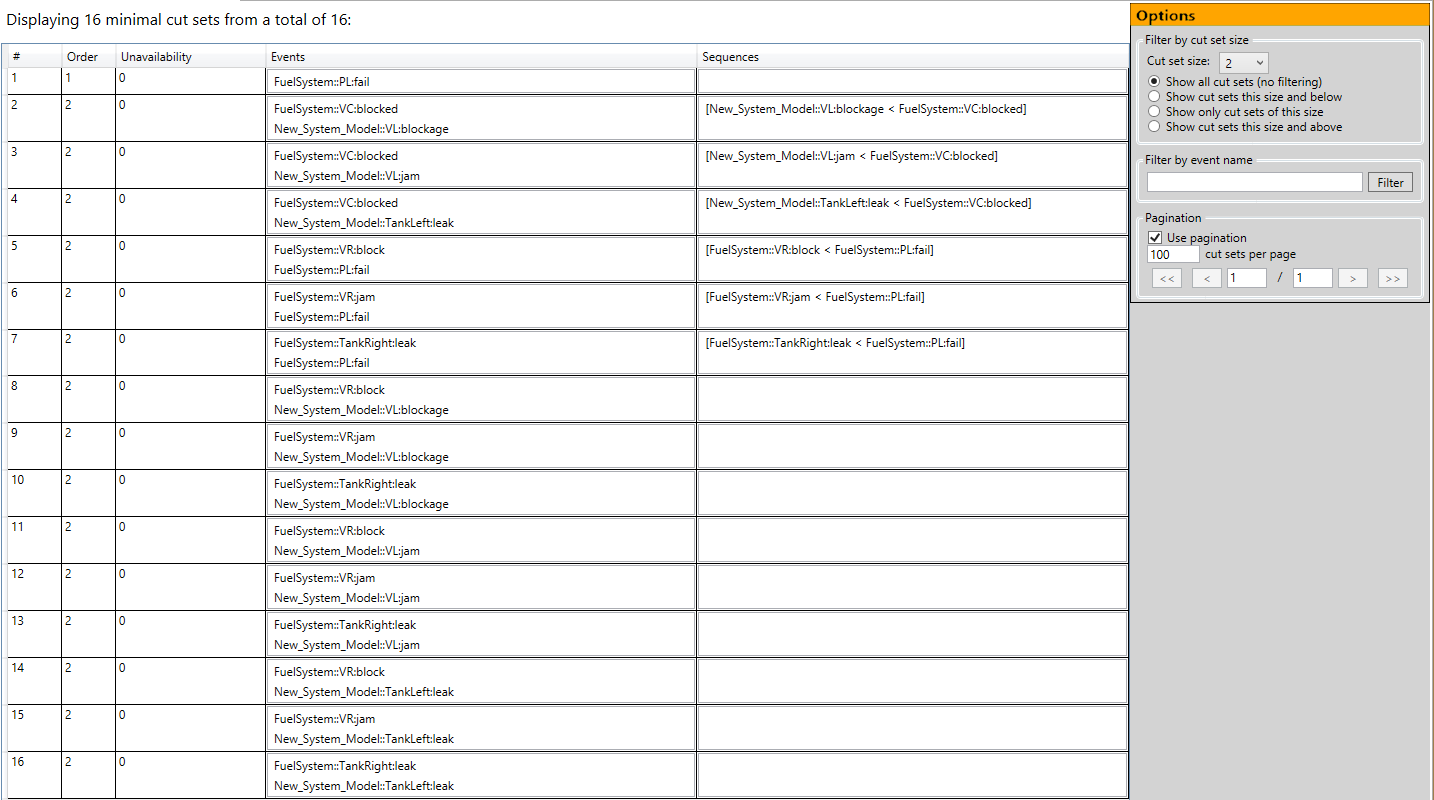
FTA Results
Like the FMEA, FTA results can be filtered and sorted. If the source fault tree was a dynamic fault tree, they can also include sequential information. In these cases, the minimal cut sets are in fact minimal cut sequences. These show not only the combination of basic events necessary to cause the system failure, but also in which sequence these events must occur (represented using the < symbol).
Each set of analysis results – combining both FMEA and FTA results – is time-stamped and preserved, enabling users to make modifications to the system design, perform a new analysis, and compare the differences in the results.
3. Export
Results can also be exported to a variety of formats, e.g. XLSX spreadsheet files.
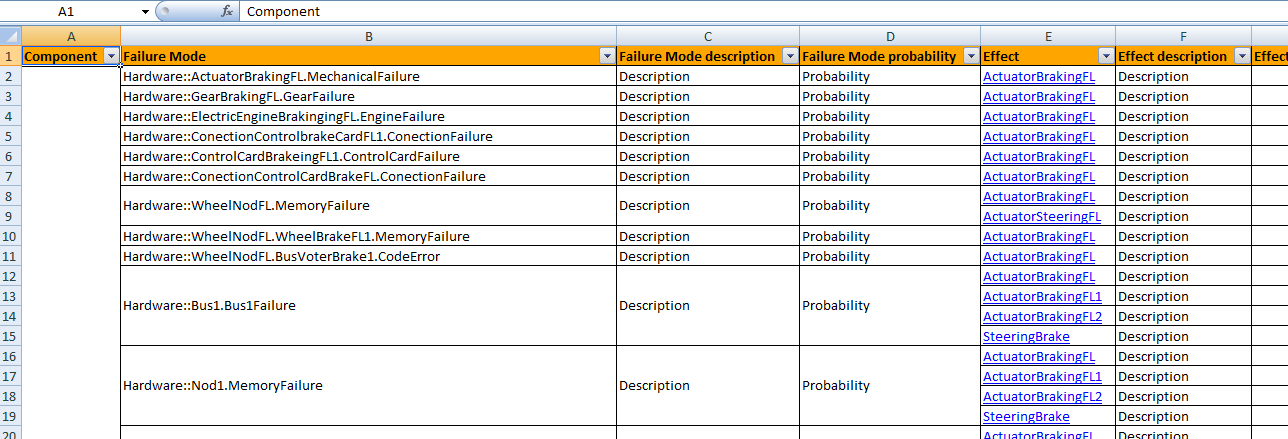
Part of an FMEA exported as a spreadsheet
We plan to add additional export options in future, including the ability to customise headers and export custom attributes defined for individual component failures, basic events, or output deviations etc.